简体中文
繁體中文
English
Pусский
日本語
ภาษาไทย
Tiếng Việt
Bahasa Indonesia
Español
हिन्दी
Filippiiniläinen
Français
Deutsch
Português
Türkçe
한국어
العربية
5 Useful Indicators for Traders
Abstract:Unlock the power of five key indicators that can revolutionize your trading strategy and guide your decisions in the dynamic world of finance.

In the world of trading, having the right tools at your disposal can make all the difference between success and struggle. Indicators serve as a guiding light, providing traders with valuable insights into market trends and potential price movements. Among the multitude of indicators available, here are five that stand out for their usefulness in aiding traders in making informed decisions.

A cornerstone of technical analysis, moving averages help smooth out price data over a specified period, presenting a clearer picture of the trend's direction. Traders often use the crossover of different moving averages, such as the simple moving average (SMA) and the exponential moving average (EMA), to identify potential entry and exit points.

The RSI is a momentum oscillator that measures the speed and change of price movements. It oscillates between 0 and 100 and is particularly useful in determining whether an asset is overbought or oversold. Traders use RSI to spot potential reversals or confirm the strength of a trend.

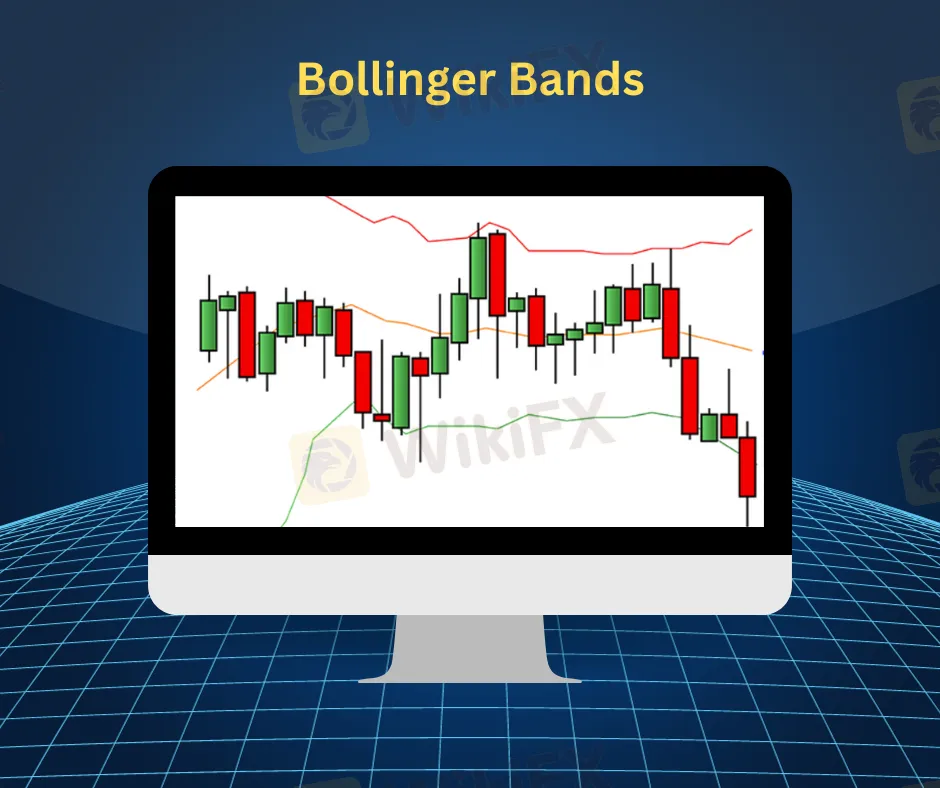
Developed by John Bollinger, these bands consist of a simple moving average and two standard deviations plotted above and below it. Bollinger Bands help traders gauge volatility and identify potential areas of support and resistance. When the price touches the upper band, it might signal overbought conditions, while touching the lower band could indicate oversold conditions.

MACD is a trend-following momentum indicator that shows the relationship between two moving averages of a security's price. Traders utilize the MACD line and signal line crossovers to identify potential shifts in momentum and trend direction.

Based on the Fibonacci sequence, this tool helps traders identify potential support and resistance levels. It uses key ratios derived from the sequence to highlight levels where the price might reverse or consolidate during a trend.
While these indicators offer valuable insights, it's crucial to emphasize that success in trading is not solely dependent on their usage. Traders must exercise caution and understand that achieving success in trading is essentially risk management. Indicators serve as a guidance tool, aiding in decision-making, but they should be complemented with a thorough understanding of market dynamics and risk assessment. Knowing when to enter or exit a trade and managing risk effectively are paramount in achieving long-term success in the financial markets.

Disclaimer:
The views in this article only represent the author's personal views, and do not constitute investment advice on this platform. This platform does not guarantee the accuracy, completeness and timeliness of the information in the article, and will not be liable for any loss caused by the use of or reliance on the information in the article.
Read more

OctaFX Flagged by Malaysian Authorities
OctaFX has been officially listed on warning lists by both Bank Negara Malaysia (BNM) and the Securities Commission Malaysia (SC). These alerts raise serious concerns about the broker’s status and whether it is legally allowed to operate in Malaysia.

IronFX Broker Review 2025: A Comprehensive Analysis of Trustworthiness and Performance
IronFX Review 2025: Explore the broker’s AAAA WikiFX rating, global regulations, and $500,000 trading prize. Is it trustworthy or a scam? Dive into our transparent analysis!

Why Your Worst Enemy in Trading Might Be You
Be Honest With Yourself: Are You Slowly Destroying Your Trading Account?

TradingPRO: A Closer Look at Its Licences
In an industry where safety and transparency are essential, the regulatory status of online brokers has never been more important. For traders seeking to protect their capital, ensuring that a platform operates under recognised and stringent oversight can make all the difference. Keep reading to learn more about TradingPRO and its licenses.
WikiFX Broker
Latest News
How much money will you earn by investing in Vantage Broker?
IronFX vs Exness Review 2025: Comprehensive Broker Comparison
Fraudsters Are Targeting Interactive Brokers' Users with Lookalike Emails
Interactive Brokers: Global Office Visits and Licensing Details
Top Tips to Choose the Best Forex Broker in 2025
SEBI Notifies New F&O Rules for Investors - New Derivative Trading Limits & More Amendments
U.S. Jobs Data Released: A Potential Boost for Gold Prices
SkyLine Guide 2025 Malaysia: 100 Esteemed Judges Successfully Assembled
Everything you need to know about ADSS
Vantage Markets Review 2025: Trusted Forex and CFD Trading Since 2009
Currency Calculator


