简体中文
繁體中文
English
Pусский
日本語
ภาษาไทย
Tiếng Việt
Bahasa Indonesia
Español
हिन्दी
Filippiiniläinen
Français
Deutsch
Português
Türkçe
한국어
العربية
Dollar Rebounds, Gold Pulls Back—Temporary Dip or a Turning Point?
Abstract:On Tuesday, spot gold retreated from a nearly four-week high, falling from $3,389 to $3,355 per ounce—a nearly 1% drop. While the pullback appears to be driven by a technical rebound in the U.S. dolla
On Tuesday, spot gold retreated from a nearly four-week high, falling from $3,389 to $3,355 per ounce—a nearly 1% drop. While the pullback appears to be driven by a technical rebound in the U.S. dollar, the broader macro narrative behind gold remains intact. In fact, as global capital structures shift, gold could be preparing for deeper, long-term safe haven demand.
“Cooling” Labor Market Turns Into Headwind for Gold
The April JOLTS report showed U.S. job openings rising to 7.391 million. However, layoffs surged to a 9-month high, and the quit rate declined, signaling waning labor momentum and weakening confidence. The market now expects Fridays nonfarm payrolls to show a sharp slowdown to 130,000 new jobs and an uptick in the unemployment rate to 4.3%.
On the surface, this should benefit gold. But heres the catch: the “weak jobs + high rates” scenario is a drag on gold until rate cuts materialize. While there's a 54% probability of a Fed rate cut in September, the odds for changes in June or July remain low. As a result, gold remains in a “test of patience” phase under a still-restrictive rate environment.
Dollar Bounce Signals Brewing Capital Conflict
Despite a steep 8.4% drop in the first five months—marking the dollar's worst start to a year in four decades—the recent rebound has weighed on gold prices. The bigger concern lies in Section 899 of the U.S. tax code—a “retaliatory tax” clause that could authorize taxation on specific foreign investments. This could escalate trade tensions into a full-blown capital war, potentially triggering a global pullback from U.S. bonds and equities. In such a scenario, gold becomes the ultimate safe harbor amid rising structural risks to dollar-based assets.
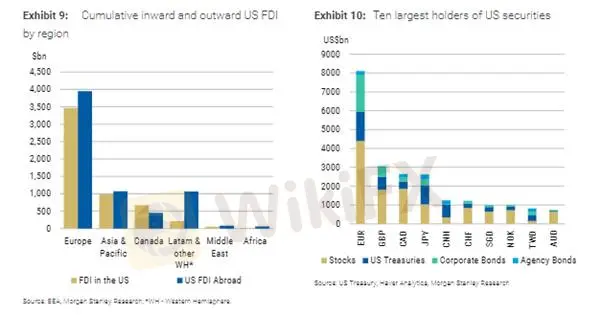
Note: The eurozone is the largest foreign holder of U.S. fixed income and equities (Source: TIC)
Eurozone Disinflation Supports a Dovish ECB—Bullish for Gold
May CPI in the eurozone dropped to 1.9% year-over-year, with core inflation also falling to 2.3%. Services inflation slowed significantly from 4.0% to 3.2%, giving the European Central Bank ample room to cut rates at its Thursday meeting. Markets are fully pricing in a 25-basis-point cut this week and even expecting a second cut later this year. However, this hinges on whether the EU and U.S. can avoid a tariff clash before July. Trumps threat to impose 50% tariffs on EU goods could spark retaliation, adding uncertainty—and potential upside for gold.
Global Bond Market Repricing—Volatility Is the New Normal
Japans 10-year government bond auction saw a strong bid-to-cover ratio of 3.66 this week, signaling solid demand. But the real test comes with the upcoming 30-year bond auction, which will gauge market tolerance for reduced central bank intervention. Globally, the bond market is transitioning from “central bank dominance” to “market-led repricing,” pushing long-term yields higher and reigniting sovereign credit concerns.
This creates a double-edged sword for gold:
High short-term yields → Bearish for gold
Rising long-term debt risk → Bullish for portfolio allocation in gold
Conclusion: Gold Isn‘t the Strongest Asset Right Now—But It’s the Ultimate Backstop
Gold may not be the top-performing asset today, but it remains the final line of defense in uncertain times. With overlapping risks from dollar movements, interest rate uncertainty, geopolitics, and capital flight, gold is likely to consolidate in the near term. However, the structural bullish trend remains. Should trade tensions escalate, investor confidence falter, or risk appetite vanish, gold will likely reclaim pricing power.
Gold Technical Outlook

Key short-term resistance lies at $3,365. A break above this level is essential to escape consolidation. The Relative Strength Index (RSI) currently sits at 60—above the neutral 50 mark—indicating positive momentum without entering overbought territory.
A clean break above $3,400—a psychological and technical resistance zone—could re-ignite bullish sentiment and open the path toward $3,450 and beyond.
Key Levels to Watch:
Resistance: $3,365 / $3,400
Support: $3,270 / $3,248
Risk Disclaimer: The opinions, analysis, research, prices, or other information provided herein are for general market commentary and do not constitute investment advice. All users should conduct their own due diligence and assume full responsibility for any trading decisions. Please proceed with caution.
Disclaimer:
The views in this article only represent the author's personal views, and do not constitute investment advice on this platform. This platform does not guarantee the accuracy, completeness and timeliness of the information in the article, and will not be liable for any loss caused by the use of or reliance on the information in the article.
WikiFX Broker
Latest News
eToro Review 2025: Top Trading Opportunities or Hidden Risks?
 WikiFX
How much money will you earn by investing in Vantage Broker?
WikiFXIronFX vs Exness Review 2025: Comprehensive Broker Comparison
WikiFXFraudsters Are Targeting Interactive Brokers' Users with Lookalike Emails
WikiFXInteractive Brokers: Global Office Visits and Licensing Details
WikiFXTop Tips to Choose the Best Forex Broker in 2025
WikiFXSEBI Notifies New F&O Rules for Investors - New Derivative Trading Limits & More Amendments
WikiFXASIC Urges Financial Licensees to Fix Register Errors Before 2026 Deadline
WikiFXU.S. Jobs Data Released: A Potential Boost for Gold Prices
WikiFXSkyLine Guide 2025 Malaysia: 100 Esteemed Judges Successfully Assembled
WikiFXCurrency Calculator

