简体中文
繁體中文
English
Pусский
日本語
ภาษาไทย
Tiếng Việt
Bahasa Indonesia
Español
हिन्दी
Filippiiniläinen
Français
Deutsch
Português
Türkçe
한국어
العربية
KVB Market Analysis | 21 Oct: Gold Hits Record Highs Amid US Election and Middle East Tensions
Sommario:Product: XAU/USDPrediction: IncreaseFundamental Analysis:Gold prices continued to print record highs after breaching the $2,700 figure amid uncertainty surrounding the US election and tensions in the
Product: XAU/USD
Prediction: Increase
Fundamental Analysis:
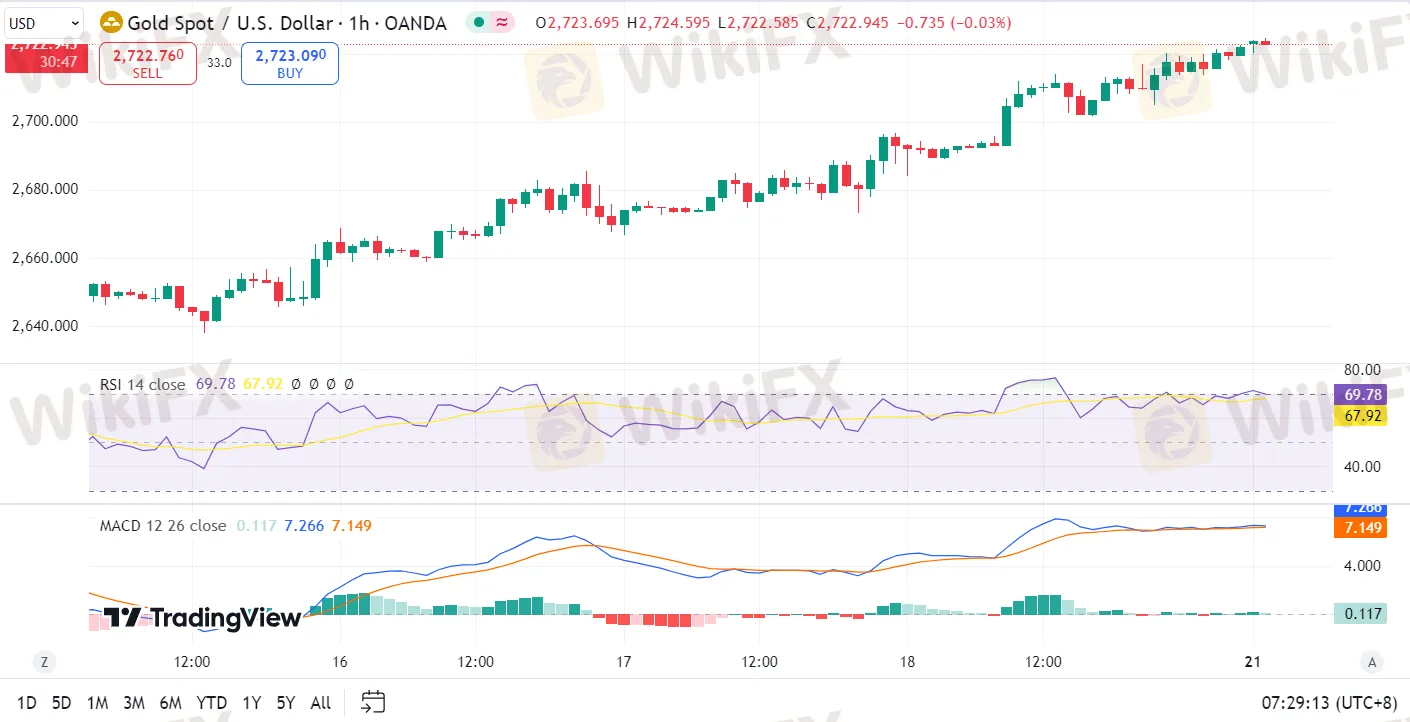
Gold prices continued to print record highs after breaching the $2,700 figure amid uncertainty surrounding the US election and tensions in the Middle East. This weighed on US Treasury bond yields and the Greenback, which tumbled to a two-day low of 103.45 after hitting a two-month peak of 103.87. At the time of writing, the XAU/USD trades at $2,721, up by 1.09%. The market mood remains upbeat as Wall Street registers modest gains.
Technical Analysis:
Gold price rally remains intact. Momentum backs bulls as depicted by the Relative Strength Index (RSI), soared and turned overbought, though with no signs of consolidating. Given the backdrop, the path of least resistance is upward. Golds first resistance would be $2,750, followed by $2,800. Conversely, if XAU/USD retreats from record highs below $2,700, it could pave the way for a pullback. The first support would be the October 17 high at $2,696, followed by the October 4 high at $2,670.

Product: EUR/USD
Prediction: Decrease
Fundamental Analysis:
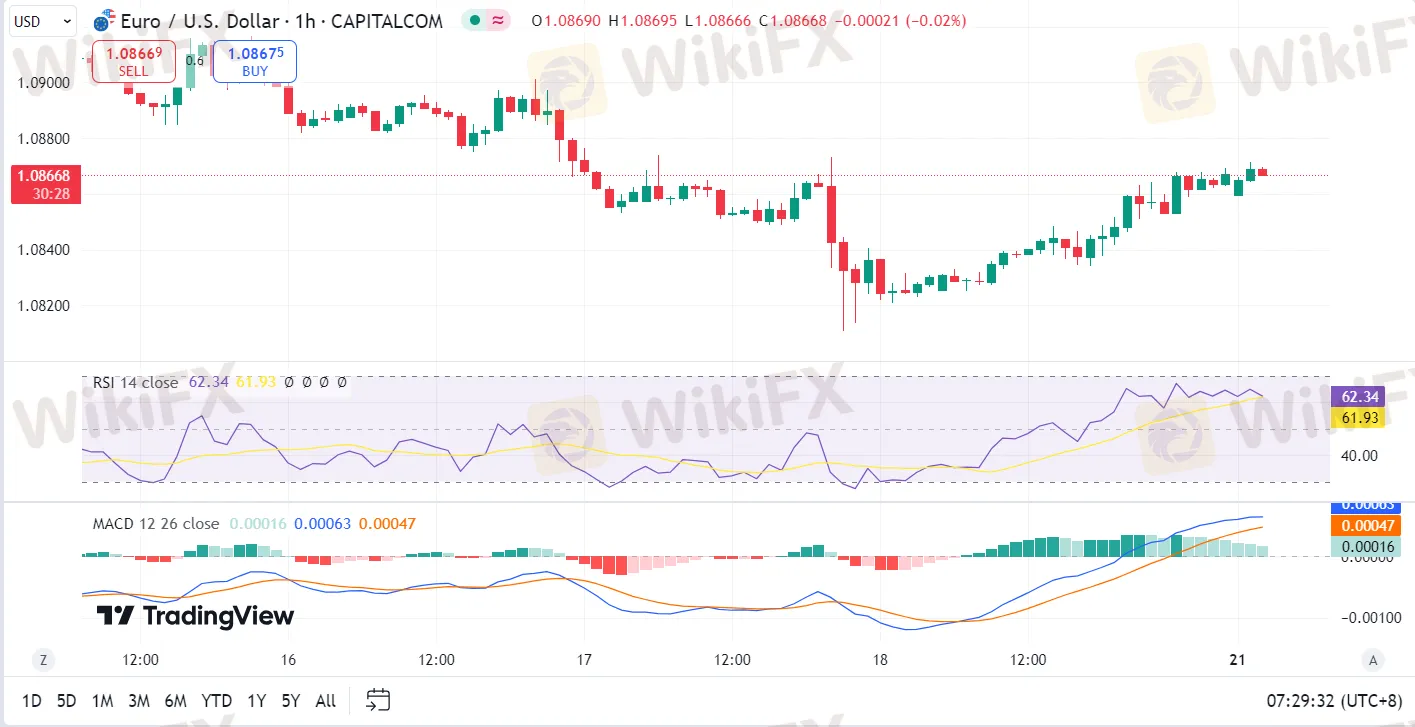
EUR/USD extended its weekly downtrend and touched its lowest level in 10 weeks at 1.0811 during the American trading hours on Thursday. Although the pair trades in positive territory near 1.0850 in the European morning on Friday, the technical outlook doesn't yet highlight a buildup of recovery momentum. The European Central Bank (ECB) lowered key rates by 25 basis points (bps) as expected following the October policy meeting. In its policy statement, the ECB noted that it will continue to follow a data-dependent and meeting-by-meeting approach in determining the appropriate level and duration of policy restriction.
Technical Analysis:
The Relative Strength Index stays slightly above 30 following the latest recovery attempt, suggesting that the bearish bias remains intact in the near term. On the upside, 1.0870 (Fibonacci 78.6% retracement of the latest uptrend) aligns as immediate resistance before 1.0900 (static level, round level). A daily close above the latter could discourage sellers and open the door for another leg higher toward 1.0950 (Fibonacci 61.8% retracement). Looking south, interim support could be spotted at 1.0830 (static level) ahead of 1.0780 (beginning point of the uptrend) and 1.0740 (static level from April).

Product: USD/JPY
Prediction: Decrease
Fundamental Analysis:
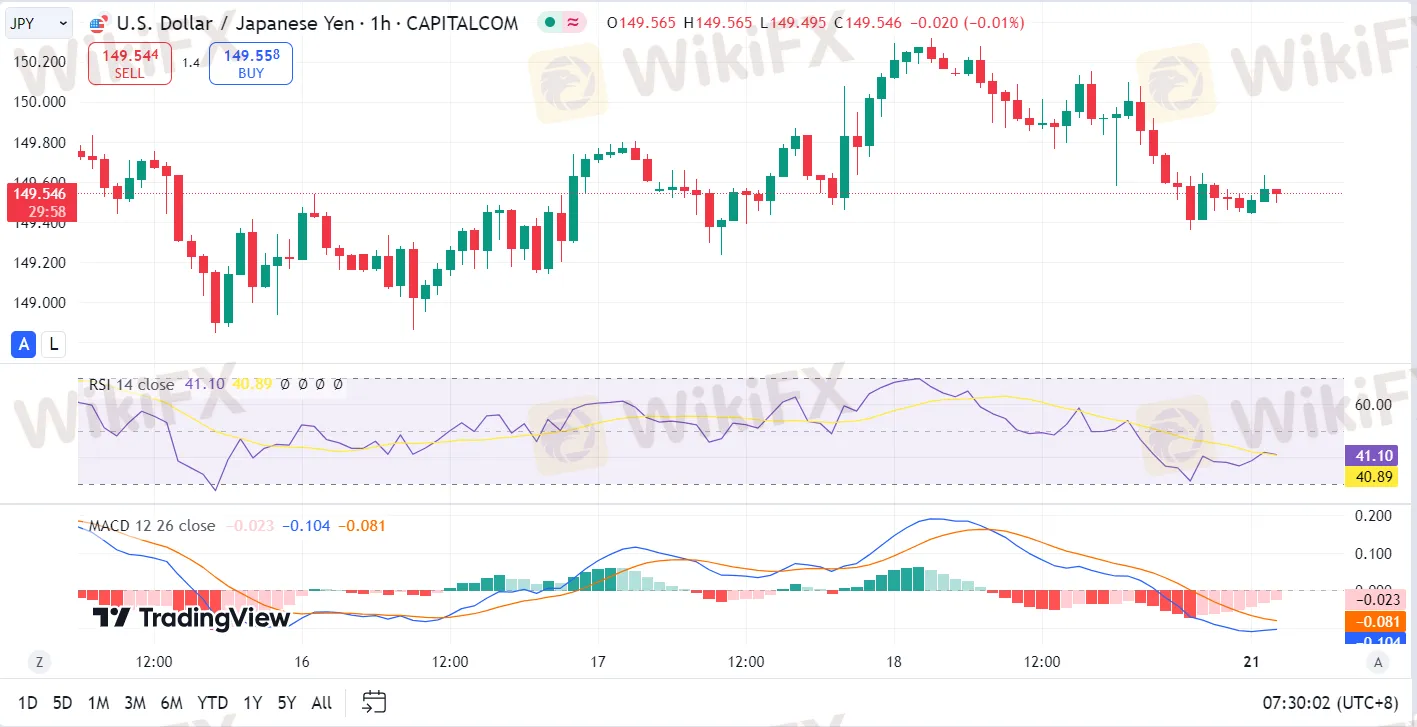
USD/JPY is experiencing a correction phase following two days of gains as mixed economic signals emerge from Japan. Despite ongoing expectations for monetary tightening by the Bank of Japan (BoJ), the yen faces downward pressure from a slowdown in domestic inflation, potentially dampening the urgency for immediate rate hikes. Japan's consumer prices increased by 2.5% year-on-year in September, marking a decrease from the 3.0% inflation rate recorded in August. This slowdown has been the first since March of this year and represents the lowest inflation level since April of this year. The core inflation index, a key metric for the BoJ, rose by 2.4%, down from 2.8% in August, yet has remained above the BoJ's target of 2.0% for 30 consecutive months. Notably, inflation excluding food and energy was recorded at 2.1% in September, a slight increase from 2.0% in August.
Technical Analysis:
The USD/JPY pair recently peaked at 150.30 and is now forming a decline towards 149.75, testing this level from above. Looking ahead, we anticipate a potential resurgence towards 151.15. A successful breach of this level could open the way to 152.09. Conversely, a drop below 149.70 could trigger a further correction down to 147.70. The MACD indicator supports this potential upward trajectory, with the signal line positioned above zero and poised to reach new highs.

Disclaimer:
Le opinioni di questo articolo rappresentano solo le opinioni personali dell’autore e non costituiscono consulenza in materia di investimenti per questa piattaforma. La piattaforma non garantisce l’accuratezza, la completezza e la tempestività delle informazioni relative all’articolo, né è responsabile delle perdite causate dall’uso o dall’affidamento delle informazioni relative all’articolo.
WikiFX Trader
FBS
FOREX.com
FXTM
TMGM
EC Markets
VT Markets
FBS
FOREX.com
FXTM
TMGM
EC Markets
VT Markets
WikiFX Trader
FBS
FOREX.com
FXTM
TMGM
EC Markets
VT Markets
FBS
FOREX.com
FXTM
TMGM
EC Markets
VT Markets
Rate Calc


