简体中文
繁體中文
English
Pусский
日本語
ภาษาไทย
Tiếng Việt
Bahasa Indonesia
Español
हिन्दी
Filippiiniläinen
Français
Deutsch
Português
Türkçe
한국어
العربية
FPG EURUSD Market Report July 16, 2025
Sommario:The EURUSD weekly chart reveals a strong bullish breakout above the prolonged consolidation range (shaded in grey) that dominated most of 2023 and early 2024. This sideways structure was capped by res
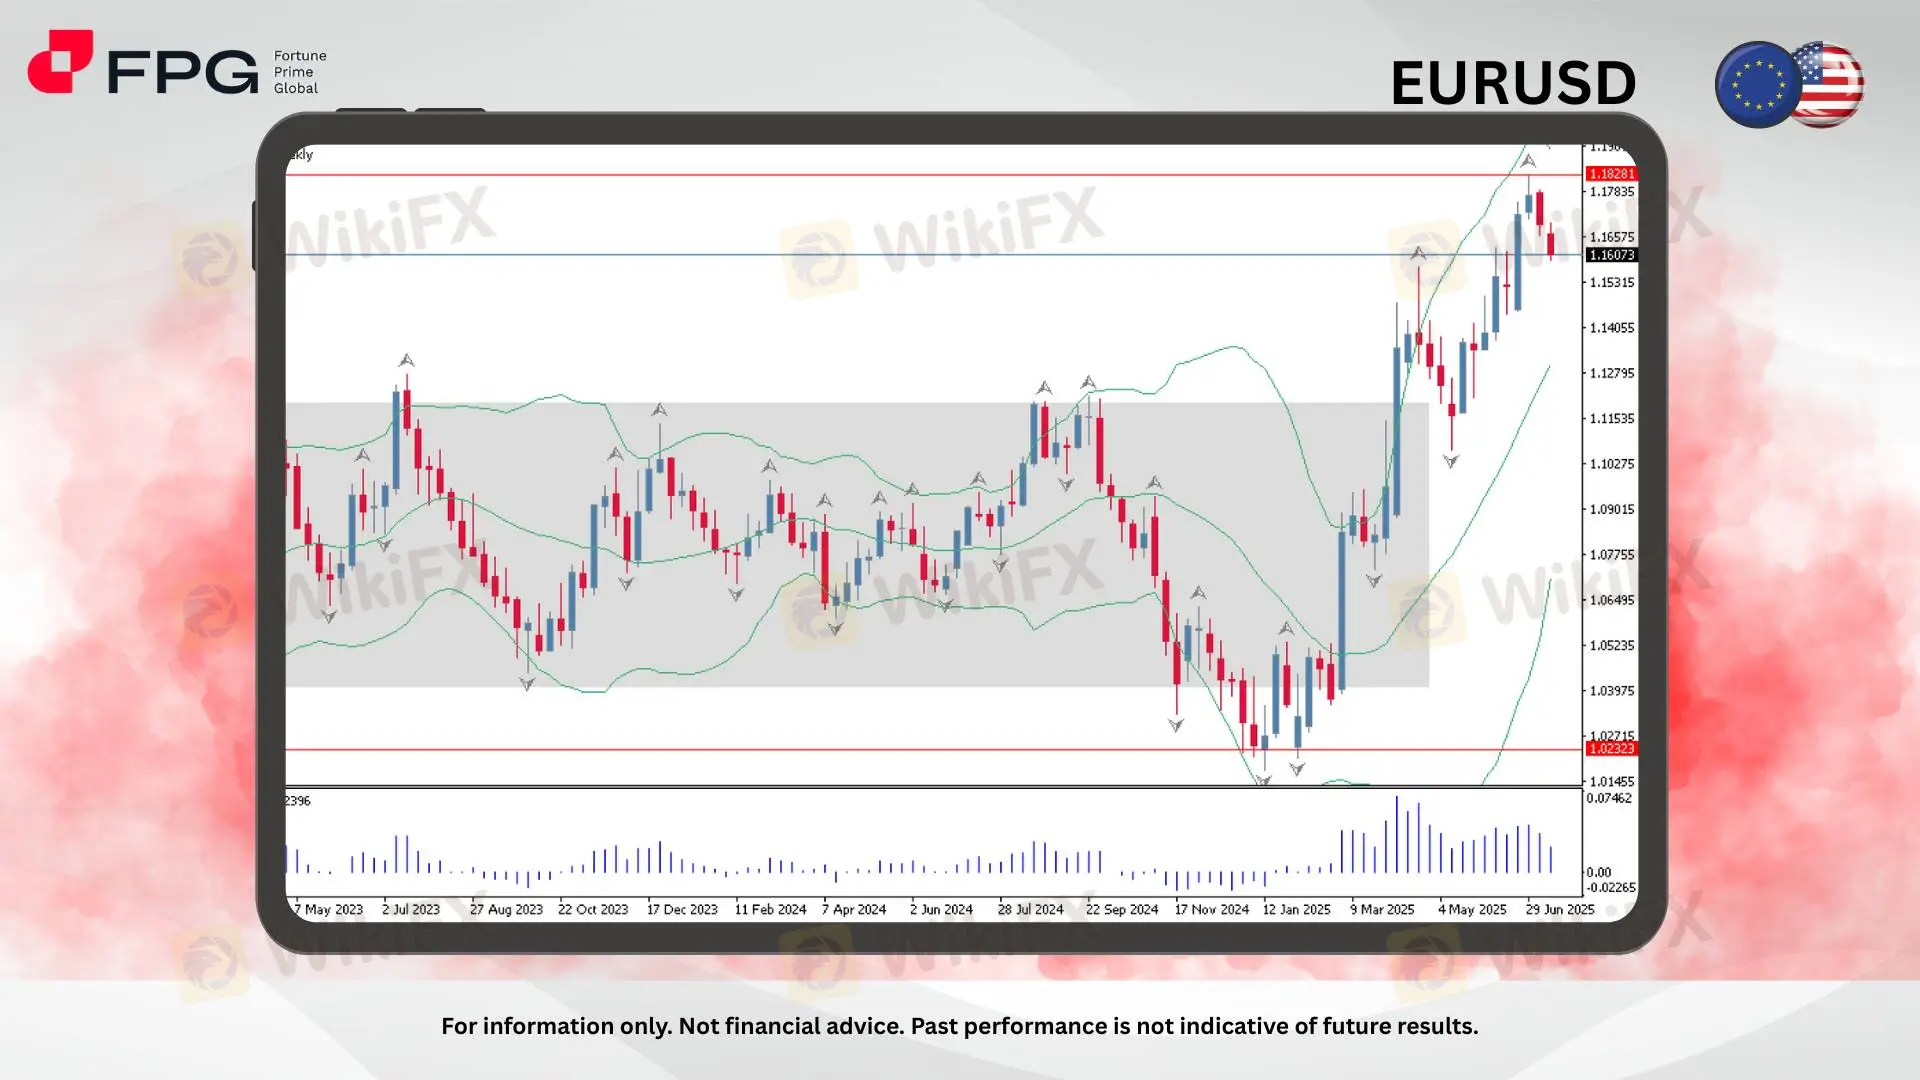
The EURUSD weekly chart reveals a strong bullish breakout above the prolonged consolidation range (shaded in grey) that dominated most of 2023 and early 2024. This sideways structure was capped by resistance around 1.1150 and support near 1.0223, marking a clear zone of indecision that persisted for over a year. However, in recent months, the pair surged decisively above this range, with strong bullish momentum breaking past the 1.1150 resistance, confirming a structural shift in market sentiment.
Currently, the pair has reached a high of approximately 1.1909 before pulling back slightly, indicating profit-taking or resistance pressure near the upper Bollinger Band. The latest weekly candle shows a mild retracement from recent highs, suggesting that price may temporarily pause or correct after its extended rally. This pullback is occurring near 1.1607, a potential support zone to watch in the coming weeks for signs of either renewed buying interest or deeper correction.
The Bollinger Bands are widely expanded, reinforcing the recent surge in volatility. Additionally, the "Bulls" indicator at the bottom suggests bullish pressure has peaked slightly, with the histogram starting to taper off. Despite this short-term hesitation, the overall market structure remains bullish as long as price holds above the breakout zone (around 1.1150–1.1300). Traders will likely watch for continuation patterns or signs of reversal near current levels, especially as the market approaches the critical resistance around 1.1828.
Market Observation & Strategy Advice
1. Current Position
EURUSD is currently trading around 1.1607, having pulled back slightly after a strong bullish rally that broke out from a long-term consolidation range. The pair recently reached a high near 1.1909, indicating an overextended move now undergoing a healthy correction or consolidation.
2. Resistance
Immediate Resistance: 1.1785 – Minor resistance near previous candle highs.
Key Resistance: 1.1828 – Strong historical resistance zone.
Long-Term Resistance: 1.1909 – Recent swing high and rally peak.
3. Support
Near-Term Support: 1.1600 – Current zone; could act as a bounce level.
Intermediate Support: 1.1300 – Previous range top, now support.
Major Support: 1.1023 – Former range bottom and demand area.
4. Indicators Reading
Bollinger Bands: Wide expansion, price pulling back from upper band – suggests potential mean reversion.
Bulls Power (13): Positive but declining – momentum is fading.
Candlestick Behavior: Recent bearish candle suggests correction or consolidation after strong uptrend.
5. Trading Strategy Suggestions
Bullish Bias:
Look for bullish confirmation near 1.1600
Targets: 1.1785 and 1.1828
Stop-loss: Below support levels.
Bearish Bias:
Watch for breakdown below 1.1600 or rejections at 1.1785/1.1828
Target: 1.1300
Stop-loss: Above rejection highs.
Neutral Outlook:
Wait for a clear breakout above 1.1828 or a deeper pullback to stronger support before engaging.
Market Performance:
Forex Last Price % Change
GBP/USD 1.3387 +0.03%
USD/JPY 148.91 +0.06%
Todays Key Economic Calendar:
UK: Inflation Rate YoY
US: PPI MoM
Risk Disclaimer This report is for informational purposes only and does not constitute financial advice. Investments involve risks, and past performance does not guarantee future results. Consult your financial advisor for personalized investment strategies.
Disclaimer:
Le opinioni di questo articolo rappresentano solo le opinioni personali dell’autore e non costituiscono consulenza in materia di investimenti per questa piattaforma. La piattaforma non garantisce l’accuratezza, la completezza e la tempestività delle informazioni relative all’articolo, né è responsabile delle perdite causate dall’uso o dall’affidamento delle informazioni relative all’articolo.
WikiFX Trader
KVB
STARTRADER
XM
FXTM
Doo Prime
OANDA
KVB
STARTRADER
XM
FXTM
Doo Prime
OANDA
WikiFX Trader
KVB
STARTRADER
XM
FXTM
Doo Prime
OANDA
KVB
STARTRADER
XM
FXTM
Doo Prime
OANDA
Rate Calc

