简体中文
繁體中文
English
Pусский
日本語
ภาษาไทย
Tiếng Việt
Bahasa Indonesia
Español
हिन्दी
Filippiiniläinen
Français
Deutsch
Português
Türkçe
한국어
العربية
Gold Prices Approach April Low, Hold at Symmetrial Triangle Support

요약:Recent changes in positioning suggest that, if a triangle breakout occurs, it would likely be to the downside.
When we last checked in on Gold prices a week ago, there was evidence (a weak US Dollar topping out) to suggest that more gains might be ahead for bullion. And while Gold prices initially rallied thereafter, the key developments that undercut the US Dollars appeal as a safe haven — dissipating concerns over the US-China trade war and Brexit – also served to undermine Gold.
In the past few days, the technical progress within the symmetrical triangle that has encapsulated price action since the start of 2019 has since been reversed. Gold prices have fallen back from near symmetrical triangle resistance and have rapidly approached symmetrical triangle support in just the span of three days.
Gold Technical Forecast: Daily Price Chart (April 2018 to April 2019) (Chart 1)
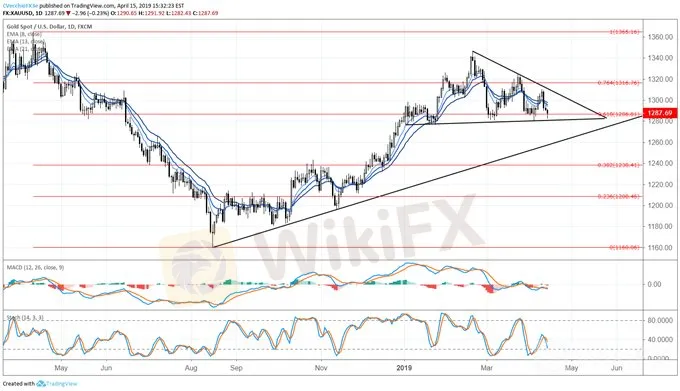
The move back towards symmetrical triangle support and the April low mean little right now as Gold prices remain within their consolidation. To this end, traders shouldnt be surprised that technical indicators are still relatively neutral.
However, there is evidence that momentum has begun to shift to the downside: price is below the daily 8-, 13-, and 21-EMA envelope; and both daily MACD and Slow Stochastics have started to turn lower below their respective median/neutral lines.
A move below the April low of 1280.80 would be a significant development in the days ahead and suggest that Gold prices may see a deeper setback towards the rising trendline from the August, September, and November 2018 lows near 1260 by the end of the month.
IG Client Sentiment Index: Spot Gold Price Forecast (April 15, 2019) (Chart 2)
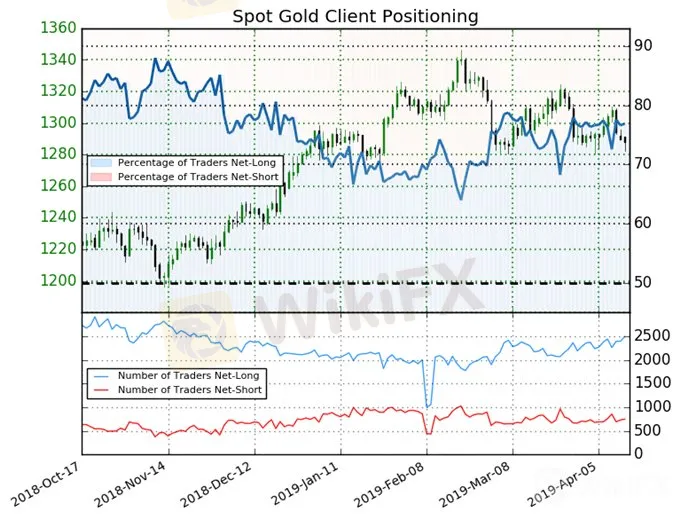
Spot Gold: Retail trader data shows 76.9% of traders are net-long with the ratio of traders long to short at 3.33 to 1. The number of traders net-long is 4.3% higher than yesterday and 9.0% higher from last week, while the number of traders net-short is 0.4% higher than yesterday and 4.5% higher from last week.
We typically take a contrarian view to crowd sentiment, and the fact traders are net-long suggests Spot Gold prices may continue to fall. Traders are further net-long than yesterday and last week, and the combination of current sentiment and recent changes gives us a stronger Spot Gold-bearish contrarian trading bias.
면책 성명:
본 기사의 견해는 저자의 개인적 견해일 뿐이며 본 플랫폼은 투자 권고를 하지 않습니다. 본 플랫폼은 기사 내 정보의 정확성, 완전성, 적시성을 보장하지 않으며, 개인의 기사 내 정보에 의한 손실에 대해 책임을 지지 않습니다.
WikiFX 브로커
환율 계산기

