简体中文
繁體中文
English
Pусский
日本語
ภาษาไทย
Tiếng Việt
Bahasa Indonesia
Español
हिन्दी
Filippiiniläinen
Français
Deutsch
Português
Türkçe
한국어
العربية
GBP/JPY Price Analysis: Fridays Doji, 21-DMA challenge recovery above 163.00
Abstract:In doing so, the cross-currency pair justifies the previous days Doji candlestick, as well as bearish MACD signals, by taking a U-turn from the 21-DMA.

GBP/JPY pares intraday gains as short-term moving average tests buyers.
Downbeat MACD signals, the previous days bearish candlestick also tease sellers.
Bears need validation from 50% Fibonacci retracement level to retake controls.
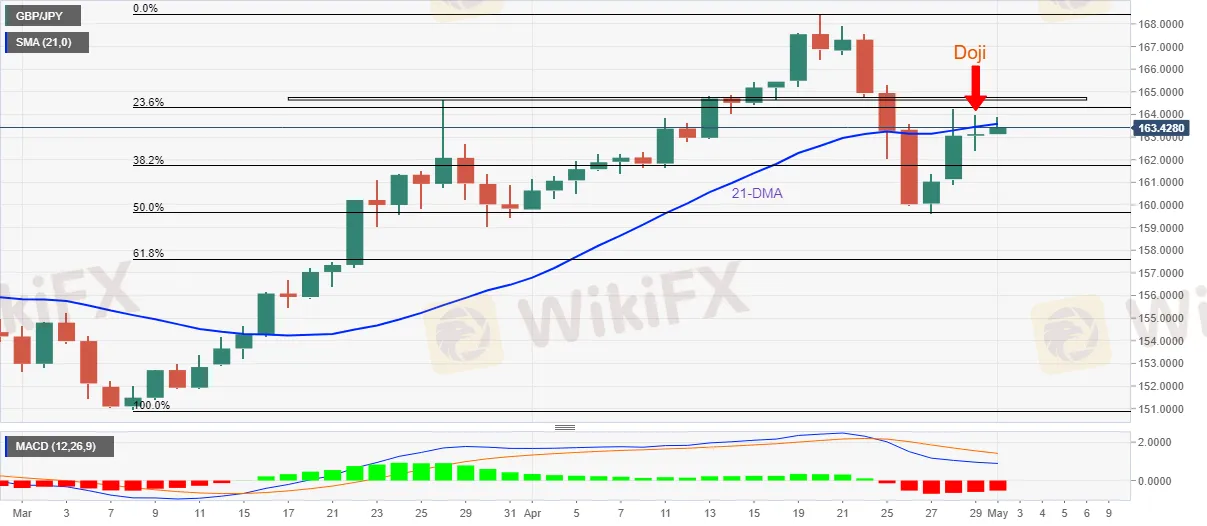
GBP/JPY retreats from the intraday high while consolidating the daily gains around 163.45 during Mondays Asian session.
Other than the 21-DMA hurdle of 163.60, a horizontal area comprising multiple levels marked since late March also challenges the GBP/JPY buyers around 164.65-75.
Should the quote rise past-164.75, the odds of witnessing a run-up towards April‘s peak of 168.43 can’t be ruled out.
On the flip side, the 160.00 threshold may entertain GBP/JPY bears ahead of directing them to the 50% Fibonacci retracement (Fibo.) of March-April upside, near 159.65.
It‘s worth noting, however, that a daily closing below 159.65 will need validation from March’s low surrounding 159.00 before highlighting the 61.8% Fibo level of 157.59 for the pair sellers.
To sum up, GBP/JPY buyers seem exhausted but the bears have a long way before retaking the control.
GBP/JPY: Daily chart

Disclaimer:
The views in this article only represent the author's personal views, and do not constitute investment advice on this platform. This platform does not guarantee the accuracy, completeness and timeliness of the information in the article, and will not be liable for any loss caused by the use of or reliance on the information in the article.
Read more

XTB Hack 2025: Major Security Breach Exposes Client Accounts
XTB suffers a major hack in 2025, with hackers draining client accounts and sparking urgent security upgrades. Learn how the breach unfolded and what’s next.

XTB Hack 2025: Major Security Breach Exposes Client Accounts
XTB suffers a major hack in 2025, with hackers draining client accounts and sparking urgent security upgrades. Learn how the breach unfolded and what’s next.

Want to Succeed in Forex? Start with the Right Trading System
If you want to trade currencies and make money in the long run, you need a good forex trading system. Many new traders enter the market without a clear plan. Some rely on luck or tips from others. But trading without a system often leads to losses.

Mumbai Police Nabs Black Paper Dollar Conversion Forex Scam Perpetrators: Check Out the Details
The crime branch of the Mumbai Police has nabbed a racket involved in duping people by claiming to convert black paper into dollars. Check this unique 24.7-lakh scam story.
WikiFX Broker
Latest News
US Government Interest Grows in Victory Metals’ Rare Earths Supply
How Are Trade Policies Affecting the Aluminum Market?
RM71,000 Lost in a Share Scheme That Never Existed
Scammed by a Click: He Lost RM300,000 in a Month
Manual vs. Automated Forex Trading: Which One Should You Choose?
Revealing Factors That Help Determine the Gold Price in India
Why Regulatory Compliance Is the Secret Ingredient to Trustworthy Forex Brokers
Pentagon to become largest shareholder in rare earth miner MP Materials; shares surge 40%
Delta shares jump 12% after airline reinstates 2025 profit outlook as CEO says bookings stabilized
Delta shares jump 13% after airline reinstates 2025 profit outlook as CEO says bookings stabilized
Currency Calculator


