简体中文
繁體中文
English
Pусский
日本語
ภาษาไทย
Tiếng Việt
Bahasa Indonesia
Español
हिन्दी
Filippiiniläinen
Français
Deutsch
Português
Türkçe
한국어
العربية
Gold Price Forecast: XAUUSD tumbles below $1,890.00 on Fed rate hike expectations, US PMI eyed
Abstract:Gold (XAUUSD) Price has slipped below $1,890.00 as the US dollar index (DXY) has been strengthened on bolstering expectations of a decent rate hike by the Federal Reserve (Fed). The uncertainty over the announcement of the interest rate decision by the Fed is forcing investors to hide behind the DXY. Fed will certainly increase its interest rate by 50 basis points (bps) in its monetary policy meeting on Wednesday.

Gold Price is expecting a fresh bullish impulsive wave as the RSI (14) has shifted into a bullish range.
Feds policy this week will keep investors on the tenterhooks.
Soaring inflation is hinting at a jumbo rate hike by the Fed.
The catalysts which need significant attention from the market participants are the balance sheet reduction and further guidance on interest rates. The guidance from the fed will provide the roadmap for marching towards the neutral rates. The age of helicopter money is shifting to a tight liquidity environment, which will bring a long-term change in various assets.
Also read: Gold, oil prices up as US consumer spending increases, Amazon sinks as Q1 earnings miss expectations [Video]
Meanwhile, the US dollar index (DXY) is attempting to sustain above 103.40 after a strong rebound in todays session as investors are seeing an outperformance from the US economy on the PMI front. The Institute for Supply Management (ISM) is expected to print the US PMI at 58 against the prior print of 57.1.
Gold technical analysis
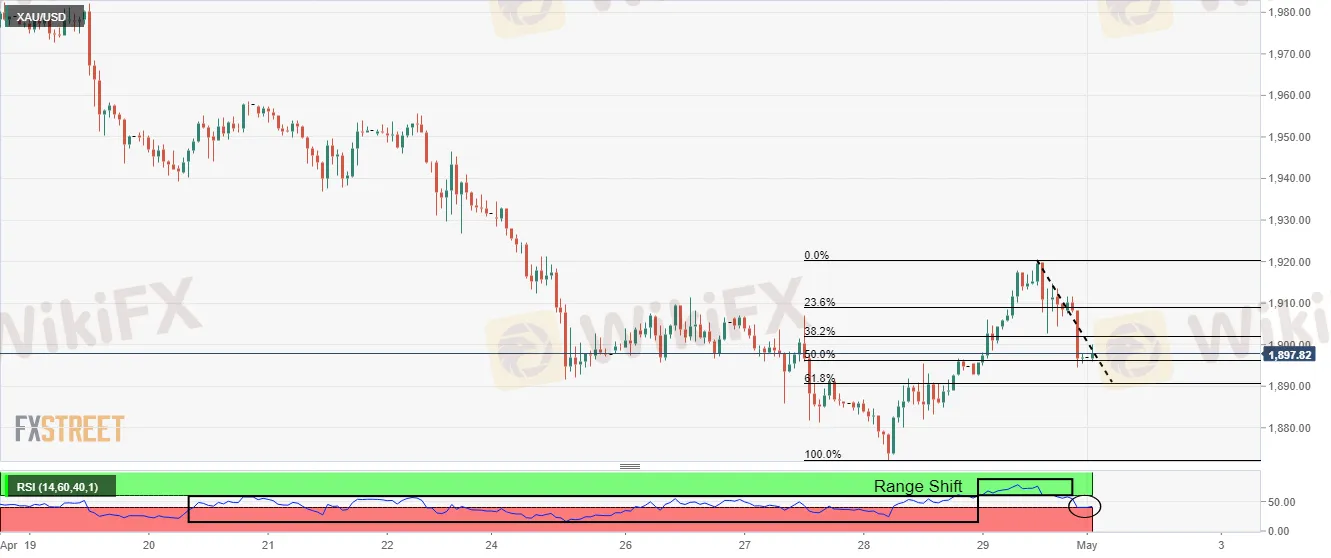
On an hourly scale, XAUUSD is trading near the 50% Fibonacci retracement (placed from last week low at $1,872.24 to Fridays high at $1,920.02) at $1,896.35, at the press time. The asset is likely to find a bullish impulsive wave after completing its correction to near 61.8% Fibo retracement at $1,890.70.
The Relative Strength Index (RSI) (14) has displayed a bullish range shift. The momentum oscillator remained in a bearish range of 20.00-40.00 and a directionless radius of 40.00-60.00 for a long period but has managed to shift into a bullish range of 60.00-80.00 and will focus on supporting itself from gyrating into a bearish range.
Gold hourly chart

Disclaimer:
The views in this article only represent the author's personal views, and do not constitute investment advice on this platform. This platform does not guarantee the accuracy, completeness and timeliness of the information in the article, and will not be liable for any loss caused by the use of or reliance on the information in the article.
Read more

FCA Warns Against Clone Brokers and Unauthorized Forex Firms in the UK
The FCA has flagged multiple clone and unauthorized forex firms, urging investors to stay alert. Learn which companies were named and how to avoid falling victim.

What Happens If You Trade on Illegal Forex Platforms in India?
There are many illegal platforms that offer financial services to clients. These scammers hide the risks involved because their main goal is to steal your money. That’s why it’s so important to understand the dangers of trading on illegal forex platforms

Exposing Trade Capital Limited - Siphoning Millions, Restricting Withdrawals, Charging Extra Fees
Trade Capital Limited is in the news for conducting bad practices as a forex broker. Check out the unethical practices employed by it to scam investors in this article.

US Federal Reserve May Cut Interest Rates in September, Says Goldman Sachs
US Federal Reserve Chair Jerome Powell may slash the policy rate in September 2025, according to research economists at Goldman Sachs. Read this to learn more.
WikiFX Broker
Latest News
MT4 vs MT5: A comprehensive comparison in terms of functionality
Top Forex Trading Strategies for the London Session
Swissquote Takes Full Control of Yuh Digital Finance App in Major Deal
Top 5 Forex Pairs Every Trader Should Have on Their Radar
What WikiFX Found When It Looked Into Decode Global
Treasury yields rise as Trump's new tariff rates in focus
Know the Major Risks of UbitMarkets, Before You Invest!
Trump's tariffs overshadow the pomp and pageantry as Macron meets King Charles
Boeing delivers most airplanes since late 2023 after ramping up 737 Max output
Inflation expectations drift back down to pre-tariff levels, New York Fed survey shows
Currency Calculator


